

Every SaaS founder eventually asks the same question: Is our churn rate normal? The answer depends on your customers, pricing model, contract length, and the way you measure churn. A monthly churn rate that may be manageable for a low-cost self-service product could signal a serious retention problem for a business selling annual enterprise contracts.
The goal is not to copy another company’s numbers. It is to understand how your retention compares with relevant benchmarks and whether your own customer cohorts are improving over time.
1. Understand the Different Types of Churn
Before comparing benchmarks, make sure you are measuring the right metric. Four commonly used measures provide different insights:
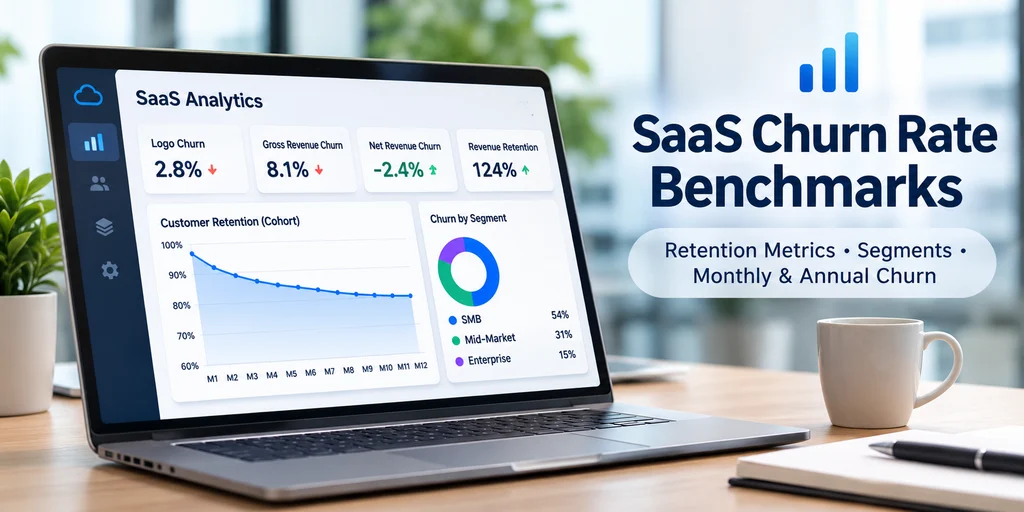
- Logo churn: The percentage of customers who cancel during a period. Each customer counts equally, regardless of how much they pay.
- Gross revenue churn: The percentage of recurring revenue lost through cancellations and downgrades, excluding expansion revenue.
- Net revenue churn: Revenue lost through cancellations and downgrades, minus expansion revenue from existing customers. It can be negative when expansion exceeds lost revenue.
- Cohort churn: The percentage of customers from a specific signup period who leave over time. Cohort analysis helps identify when customers are most likely to cancel.
These metrics should never be treated as interchangeable. For example, a company can lose several small customers while increasing revenue from larger existing accounts.
2. SaaS Churn Benchmarks by Business Segment
Churn varies significantly between customer segments. Smaller businesses often have tighter budgets and shorter purchasing cycles, while enterprise customers typically have longer contracts and more complex buying processes.
SMB and Self-Service SaaS
Small and medium-sized businesses often experience higher customer churn. Their budgets can change quickly, and they may cancel software when priorities or business conditions change.
For these products, monitor monthly logo churn, activation rates, customer acquisition cost, and the time required to recover acquisition spending. A high cancellation rate should prompt an investigation into onboarding, product value, pricing, and customer fit.
Mid-Market SaaS
Mid-market customers usually involve more stakeholders and structured purchasing decisions. Their retention depends on product adoption, measurable business value, customer support, and successful implementation.
Track both customer churn and gross revenue retention. Pay particular attention to accounts with declining product usage, unresolved support issues, or changes in key decision-makers.
Enterprise SaaS
Enterprise contracts often run annually or across multiple years. As a result, cancellations may become visible at renewal rather than appearing gradually each month.
Monitor renewal rates, annual gross revenue retention, expansion revenue, and customer health before renewal dates. A small number of lost enterprise accounts can have a significant effect on recurring revenue.
What Published Research Shows
Benchmark reports provide useful context, but their results depend on their sample and methodology.
For example, Lighter Capital’s 2025 B2B SaaS benchmark report reported median annual customer churn of 16.25% and median annual revenue churn of 12.50%.
HSBC Innovation Banking’s 2026 enterprise software benchmarking survey reported median annualised churn of 13% for 2025. These figures come from different datasets and should not be treated as directly comparable.
Sources:
- Lighter Capital: 2025 B2B SaaS Startup Benchmarks
- HSBC Innovation Banking: Enterprise Software Benchmarks 2026
3. How to Convert Monthly Churn into Annual Churn
Monthly churn should not simply be multiplied by twelve. Customer losses compound over time.
Use this formula:
Annual churn = 1 − (1 − monthly churn)^12
For example, a 5% monthly churn rate produces approximately 46% annual churn, not 60%. This means that, under a constant monthly churn assumption, about 54% of the original customer cohort remains after twelve months.
The same calculation helps estimate customer lifetime. At a constant 5% monthly churn rate, the simplified expected lifetime is approximately 20 months. At 3%, it is approximately 33 months.
These are mathematical estimates, not guarantees about how long an individual customer will stay.
Understanding churn also helps businesses evaluate their CAC payback period and customer lifetime value.
4. How to Analyse Your Own Churn Rate
A single monthly figure rarely explains why customers leave. Use these three checks to understand what is happening:
- Separate paying customers from trials. Do not mix trial users or failed first payments with paying subscribers. However, a customer who paid and later cancelled still counts as churn, even if they never completed onboarding.
- Separate voluntary and involuntary churn. Voluntary churn happens when customers choose to cancel. Involuntary churn happens when payments fail, often because of expired cards or other billing problems. Review each category separately.
- Analyse customer cohorts. Group customers by signup month or quarter and track how many remain over time. This reveals whether newer customers are retaining better than earlier groups.
5. When Churn Signals a Pricing or Product Problem
Customers cancelling at the same point in their subscription can indicate a deeper issue.
For example, cancellations shortly after the first renewal may suggest that customers do not see enough continuing value. The problem could involve product adoption, missing features, unclear pricing, or a mismatch between expectations and actual results.
A usage-based pricing model may be worth evaluating when customer value increases with product usage. However, it is not a universal solution. Variable bills can make revenue less predictable and may create concerns for customers.
Before changing prices, investigate cancellation reasons and compare customer usage with the value your product promises.
6. A Practical Customer Cohort Example
Suppose 500 paying customers sign up in January, each paying $200 per month. The starting monthly recurring revenue (MRR) is $100,000.
- End of month three: 410 customers remain. Logo retention is 82%. The business should investigate why 90 paying customers cancelled, including whether onboarding difficulties contributed.
- End of month six: 372 customers remain. Logo retention is 74.4%. If some remaining customers upgraded, total cohort revenue could reach $81,000, representing 81% revenue retention.
- End of month twelve: 340 customers remain. Logo retention is 68%. If the cohort generates $79,000 in monthly revenue, expansion has helped offset some of the revenue lost through cancellations.
This example shows why customer retention and revenue retention should be reviewed together. A business may lose customers while increasing revenue from the customers who stay.
7. Why Your Own Retention Trends Matter More Than Generic Benchmarks
Comparing your company with a public SaaS business can be misleading. Companies differ in annual contract value, customer size, pricing, product maturity, and customer acquisition strategy.
Instead, compare your own customer cohorts over several quarters. Look for improvements in activation, product adoption, renewal rates, and expansion revenue.
A benchmark can help identify a potential problem, but your customer data should guide the decision.
Frequently Asked Questions
Is 5% monthly churn bad?
It depends on the product and customer segment. It may occur in some low-cost self-service products, but it deserves investigation in a business selling higher-value contracts.
Should SaaS companies measure churn monthly or annually?
Track churn at the frequency customers can cancel. Monthly subscriptions need monthly analysis, while annual contracts should also be evaluated around renewal periods.
What is the difference between gross and net revenue churn?
Gross revenue churn measures recurring revenue lost through cancellations and downgrades. Net revenue churn also accounts for expansion revenue from existing customers.
Does negative net revenue churn mean no customers are leaving?
No. It means expansion revenue from existing customers exceeds revenue lost through cancellations and downgrades. Customer cancellations can still occur.
How many customers do you need before churn data becomes useful?
There is no universal minimum. With a small customer base, one cancellation can significantly change the monthly rate. Use cohort trends, longer measurement periods, and customer feedback to interpret the numbers.
Explore More with Blyntora
Understanding churn is only one part of building a sustainable SaaS business. Explore our latest articles on Blyntora for practical insights into SaaS metrics, pricing strategies, customer retention, technology, and business growth.
Blyntora — Practical insights for a changing digital world.